One of the key takeaways from this year’s list of Top 50 Global third-party logistics providers (3PLs) - compiled by market consultancy Armstrong & Associates - is that business forecasting is becoming increasingly important to shippers when choosing the provider that best fits their needs.
This notion becomes even more urgent when one considers that the 3PL market compound annual growth rate (CAGR) from 1996 to 2012 fell 0.3 percent to 10 percent.
Domestic transportation management (DTM) led financial results for 3PL segments again in 2012. Gross revenues were up 9.2%, and at the same time, the cost of purchasing transportation, increased competition, and slackened demand are pressuring DTM gross margins and net revenues.
As a result, net revenues increased by only 5.4 percent. Overall gross margins were 14.6 percent—in 2011 they were 15.2 percent. However, overall 3PL earnings before interest, tax, and net income margins remained strong, ringing in at 33.2 percent and 20.3 percent of net revenue respectively.
The key to sustaining that net income trend appears to be in the top provider’s ability to anticipate market trends, say analysts.
“Third party logistics providers are good at modeling transportation and distribution networks and identifying overall shifts in demand,” notes Evan Armstrong, the consultancy’s president. “But they also have the forecasting tools associated with integrated warehousing and transportation management.”
According to Armstrong, the leading players in the value-added area of forecasting are Menlo Worldwide, Ryder SCS, APL Logistics, Genco, UTi, and DB Schenker. “Based on our findings,” he says, “these companies can be leveraged by shippers to identify key inventory deployment locations and lower-cost transportation lanes.”
Armstrong & Associates Top 50 Global 3PLs
-
2012 Gross Logistics Revenue (USD Millions)*Third-Party Logistics Provider
-
$31,639DHL Supply Chain & Global Forwarding
-
$22,141Kuehne + Nagel
-
$20,321Nippon Express
-
$19,789DB Schenker Logistics
-
$11,359C.H. Robinson Worldwide
-
$9,832Hyundai GLOVIS
-
$9,290CEVA Logistics
-
$9,147UPS Supply Chain Solutions
-
$7,759DSV
-
$7,523Sinotrans
-
$7,060Panalpina
-
$7,038SDV (Bolloré Group)
-
$6,760Toll Holdings
-
$5,981Expeditors International of Washington
-
$5,868Geodis
-
$5,670DACHSER
-
$5,267GEFCO
-
$4,608UTi Worldwide
-
$4,605Agility
-
$3,800IMPERIAL Logistics
-
$3,593Hellmann Worldwide Logistics
-
$3,526Yusen Logistics
-
$3,272Damco
-
$3,155Kintetsu World Express
-
$3,124Hub Group
-
$2,933Burris Logistics
-
$2,700Schneider Logistics & Dedicated
-
$2,689Sankyu
-
$2,601Pantos Logistics
-
$2,490Kerry Logistics
-
$2,366Norbert Dentressangle
-
$2,280Ryder Supply Chain Solutions
-
$2,090FIEGE Group
-
$1,895BDP International
-
$1,747Wincanton
-
$1,730Neovia Logistics Services
-
$1,726Menlo Worldwide Logistics
-
$1,703Logwin
-
$1,609Nissin Corporation/Nissin Group
-
$1,580Americold
-
$1,555APL Logistics
-
$1,540BLG Logistics Group
-
$1,536J.B. Hunt Dedicated Contract Services & Integrated Capacity Solutions
-
$1,476GENCO
-
$1,387Total Quality Logistics
-
$1,350Landstar
-
$1,300Transplace (View all Transplace Resources)
-
$1,200OHL
-
$1,090Werner Enterprises Dedicated & Logistics
-
$1,058Swift Transportation
*Revenues are company reported or Armstrong & Associates, Inc. estimates and have been converted to USD using the average exchange rate in order to make non-currency related growth comparisons.
Armstrong & Associates Top 30 U.S. Domestic 3PLs on the next page.
At the same time, Armstrong notes that domestic “mega trends” such as near-shoring and re-shoring of manufacturing operations are being supported by the Top 30 Domestic 3PLs.
“Many major domestic transportation management 3PLs, such as Con-way Multimodal, Transplace, and BNSF Logistics have developed significant cross border capabilities to handle transportation between Mexico and the U.S. and within the U.S.,” says Armstrong.
Since the enactment of NAFTA in 1994, trade between the United States, Canada and Mexico has increased almost 200 percent to an estimated $930 billion. The cross-border flow of goods between the U.S. and Canada has grown to $400 billion.
There’s no doubt that free trade has made a positive impact on cross-border shipping. As goods flow more freely and the speed of transit increases, shippers will be able to enjoy reduced risk. But the traffic lanes aren’t completely clear yet.
He also observes that surges in oil and gas production in North Dakota around the Bakken Formation are driving increased operational focus from 3PLs and multimodal transportation providers.
“Service providers and shippers are working hand-in-hand to manage supply chain shifts,” adds Armstrong.
Armstrong & Associates Top 30 U.S. Domestic 3PLs
-
2012 Gross Logistics Revenue (USD Millions)*Third-Party Logistics Provider
-
$11,359C.H. Robinson Worldwide
-
$9,147UPS Supply Chain Solutions
-
$5,981Expeditors International of Washington
-
$4,878Kuehne + Nagel (The Americas)
-
$4,608UTi Worldwide
-
$4,500Exel (DHL Supply Chain - Americas)
-
$4,034DB Schenker Logistics
-
$3,124Hub Group
-
$2,933Burris Logistics
-
$2,787CEVA Logistics (The Americas)
-
$2,700Schneider Logistics & Dedicated
-
$2,280Ryder Supply Chain Solutions
-
$2,120Panalpina (The Americas)
-
$1,895BDP International
-
$1,730Neovia Logistics Services
-
$1,726Menlo Worldwide Logistics
-
$1,580Americold
-
$1,536J.B. Hunt Dedicated Contract Services & Integrated Capacity Solutions
-
$1,476GENCO
-
$1,387Total Quality Logistics
-
$1,350Landstar
-
$1,300Transplace
-
$1,200OHL
-
$1,090Werner Enterprises Dedicated & Logistics
-
$1,058Swift Transportation
-
$1,050NFI
-
$1,046Greatwide Logistics Services
-
$1,037Universal Truckload Services
-
$1,028FedEx Trade Networks/FedEx Supply Chain Services
-
$1,025APL Logistics (The Americas)
*Revenues are company reported or Armstrong & Associates, Inc. estimates and have been converted to USD using the average exchange rate in order to make non-currency related growth comparisons.
Need to go global
Armstrong contends that “mega cities” in developing countries with above average per capita income rates of growth such as Shanghai, Bangkok, Mumbai, Hanoi, Jakarta, and Sao Paulo will drive consumer demand for finished goods globally.
Forward-looking U.S. based 3PLs such as Jacobson, Menlo Worldwide, and OHL have invested heavily in expanding international operations to meet the new challenges, he adds.
“Most U.S.-based shippers are very interested in working with top-notch domestic 3PLs internationally,” says Armstrong. “All 3PLs should be looking for ways to tap international markets with above average growth rates and meet the logistics needs in those rapidly growing mega cities.”
Armstrong has seen significant global expansions by APL Logistics, Dimerco, Jacobson, Kerry, Geodis, Menlo Worldwide, and Toll into high-growth regions.

“If a 3PL has positioned itself as a strategic provider for a multinational customers, it should leverage those relationships to help drive international expansion,” he says. “Global size and scale are important competitive differentiators in the global 3PL market and need to be part of every 3PL’s strategy.”
Analysts at Gartner agree, noting that large multinational and global shippers have started to require that their 3PLs offer more extended services across more regions—and integrate those services across end-to-end business processes.
“The 3PL industry is progressing along a maturity spectrum, in accordance with these new customer requirements, through a combination of acquisition and organic growth strategies,” observes Greg Aimi, Gartner’s director of supply chain research.
Unlike Armstrong, however, Aimi feels that 3PLs could do a better job of forecasting and pointing shippers in the right direction for future investment.
“Our research shows that most 3PLs only did what their shippers asked them to do,” says Aimi. “Original innovation and opportunity was rare from their 3PLs. Most shippers say that their 3PLs were very constructive and even innovative at developing solutions to challenges or opportunities that the customer organization raised, but that they wished the providers could have brought more industry innovation and improvement opportunity to bear on their own.”

Aimi, who is co-author of the recently-released report Magic Quadrant for Global Third-Party Logistics Providers, emphasizes that the time is now for more 3PL forecasting.
“The phenomenon of the ‘mega city’ will drive the need for intentional sharing of logistics and infrastructure resources,” he says. “This so-called ‘collaborative logistics’ means that companies will work together to reduce additional waste and inefficiencies of supply chains operating in isolation.”
In evaluating various global 3PL players, Gartner grouped them into various categories, including challengers, players, niche players, and visionaries.
And in order to participate in the Magic Quadrant, Gartner considered only 3PLs whose depth and breadth could cover regional and multiple service requirements were considered.
Gartner predicts that the following two emerging trends will drive logistics and supply chain professionals to explore collaborative logistics further within the next five years:
- Rapid growth causing more urban congestion: The number of cities with populations of more than eight million is projected to double by 2019. By 2020, Mumbai, Delhi, Mexico City, Sao Paulo, New York, Dhaka, Jakarta, and Lagos will achieve “mega city” status—or more than 20 million people—and there will be many more consumers in smaller, more congested locations.
- Consumer and corporate sustainability demands: These concerns will continue to drive CO2 reductions, as well as the sustainable supply of products and services. “3PLs will be in prime position to offer these collaborative services as they can be the arbitrator of resources and costs,” says Aimi. “Sustainability might also boost the concept of the distribution parks or campuses whereby co-location of different companies materials and goods facilitate optimization of shared logistics resources and costs.”
Narrowing the field
The types of shippers served by the 3PLs in Gartner’s Magic Quadrant are global, multinational, multi-billion dollar corporations, many of whom use dozens of services providers. However, Aimi notes that this too may be changing.

“There will always be room for a strong, local provider with local expertise and widely available local resources,” says Aimi. “The largest companies are trending toward wanting a smaller set of global preferred providers. However, most of these global providers will have ‘best in class’ local representation—especially in the most well developed markets.”
Aimi insists that the major challenge for shippers will be to determine how quickly they will want to extend their reach. They will also have to define their customer base and determine if local service can surpass the benefits of having a global preferred provider taking on more of the business.
The goal, he adds, will be ultimately to reduce integration complexity, have more standard global processes, and foster end-to-end process improvement.
“It’s also worth noting that the local, large North American providers are wondering when Gartner will do “localized” versions of our quadrant study so that they can be included,” says Aimi.
One of the interesting things about this particular quadrant, adds Aimi, is that the “leaders” are not very far into the Leadership quadrant in terms of Completeness of Vision. “This is indicative of the fact that even the largest and most diverse 3PLs are still a long way from providing what shippers really want from their providers, keeping them from becoming true strategic global preferred providers across a host of service offerings.”
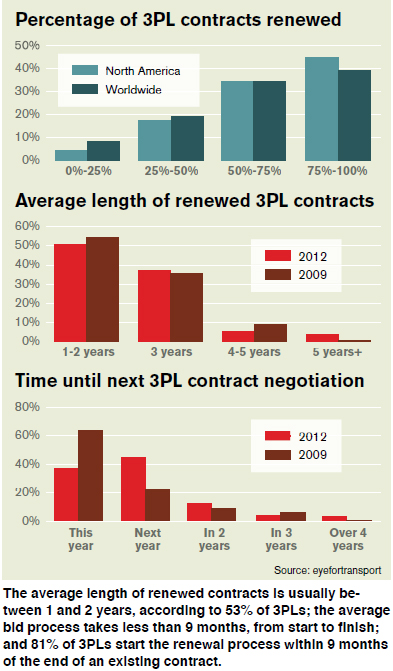
A survey done by the London-based think tank Eyefortransport (EFT) comes to many of the same conclusions, noting that contract renewals are declining as shippers seek to cut down on their reliance of multiple 3PLs. Furthermore, say EFT researchers, shippers are less likely to sign long-term contracts in the future.
EFT research analyst Katharine O’Reilly observes in the report 3PL Selection & Contracts Renewal Report that the percentage of North American shippers renewing over 50 percent of their 3PL contracts has dropped from 83 percent to 73 percent since the last survey was taken. Four percent of the 3PLs that participated in the study reported less than half of their contracts renewed.
“Four years ago none had a renewal rate under 50 percent,” says O’Reilly. “Only 10 percent of the renewals exceed a contract term of three years, whereas 53 percent range from one to two years.”
The survey, which solicited responses from global shippers, logistics providers and consultants, included some multinationals with annual revenues exceeding $25 billion. Sixty-four percent of the respondents had revenues in excess of $50 million. Nearly half of the respondents (48 percent) were based in North America, 34 percent hailed from Europe and 11 percent from the Asia-Pacific region.
Adrian Gonzalez, president of the supply chain consultancy Adelante SCM, and lead contributor for Logistics Viewpoints, says this narrowing of the field is not necessarily a negative. “There’s a switching cost associated with outsourcing relationships. It takes time for a 3PL to understand a shipper’s business, for both parties to trust each other, and for personal relationships to develop,” he says.
Gonzalez notes that if a shipper switches to a new 3PL, they must build the relationship from “scratch” again. Also, there’s a cost associated with managing 3PL relationships—the more 3PLs shippers have, the more time and resources are required to manage those relationships.

“Therefore, shippers may try to limit the number of partners they work with,” says Gonzalez. “They don’t want to put all of their eggs in one basket, but they also don’t want to have a basket full of 3PL partners either.”
Future shock?
So what can shippers expect of their 3PLs in the future? According to two of the giant players in our global ranking, business forecasting will certainly be a significant piece of their offerings.
“A key value that 3PLs can provide shippers is market knowledge across multiple regions and industries,” says Alan Amling, UPS global director of contract logistics marketing. “Another value is to help companies take advantage of the growth opportunities they decide to pursue.”
According to Amling, the major providers also have existing infrastructure in global markets; so, after the forecast is made, they can build upon their in-country expertise to help companies navigate trade regulations, get products to end customers, and provide post-sales services.
Jordan Kass, vice president of management services for C.H. Robinson, agrees, noting that the industry leaders have the access to capital to move forward on their predictions. “When we see a trend building—“mega cities,” for example—we can invest in the technological resources necessary to help shippers gain a foothold there.”
Both Amling and Kaas also observe that the convergence of technology and emerging market demand are forces that will shape the 3PL global landscape in 2013 and beyond.
About the Author
Follow Robotics 24/7 on Linkedin
Article topics
Email Sign Up


